

This is likely no surprise to you, but drought persists across the U.S. and is intensifying in some areas. No geographic area is immune to the potential of drought at any given time. The U.S. Drought Monitor provides a weekly drought assessment, and it plays an important role in USDA programs that help farmers and ranchers recover from drought.
The Facts
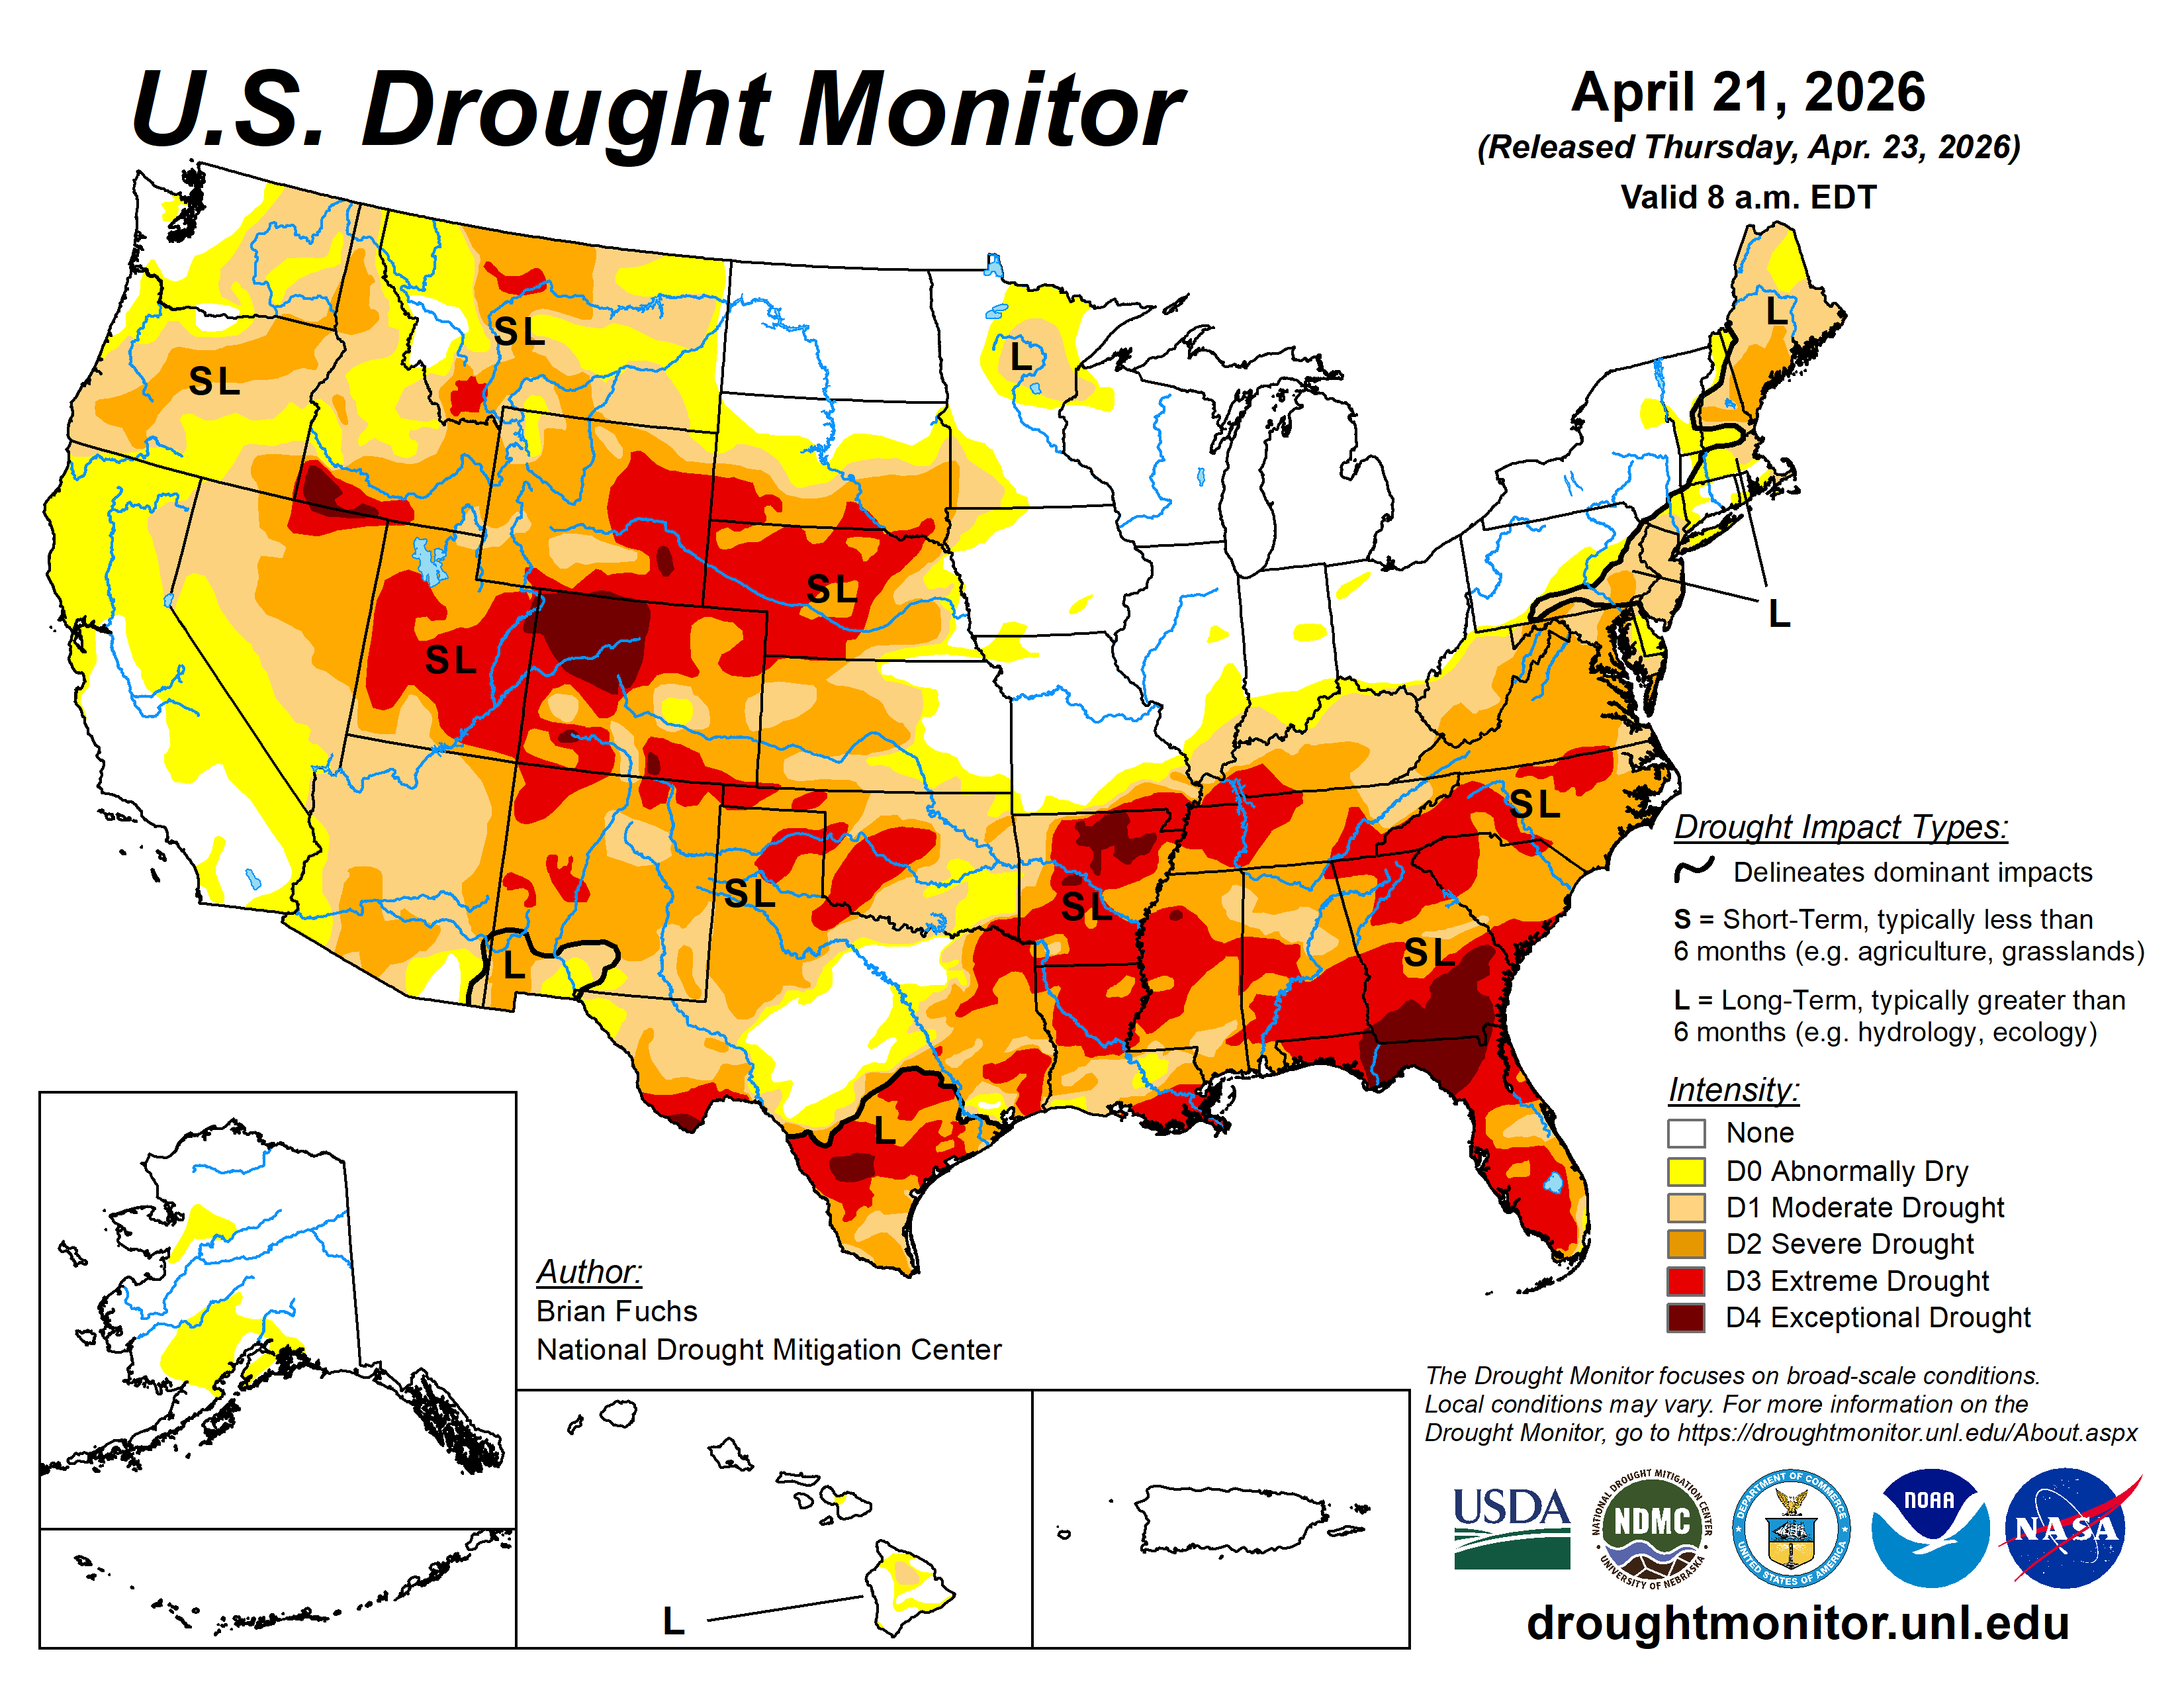
Fact #1 - Numerous agencies use the Drought Monitor to inform drought-related decisions.
The map identifies areas of drought and labels them by intensity on a weekly basis. It categorizes the entire country as being in one of six levels of drought. The first two, None and Abnormally Dry (D0), are not considered to be drought. The next four describe increasing levels of drought: Moderate (D1), Severe (D2), Extreme (D3) and Exceptional (D4).
While many entities consult the Drought Monitor for drought information, drought declarations are made by federal, state and local agencies that may or may not use the Drought Monitor to inform their decisions. Some of the ways USDA uses it to determine a producer’s eligibility for certain drought assistance programs, like the Livestock Forage Disaster Program and Emergency Haying or Grazing on Conservation Reserve Program acres and to “fast-track” Secretarial drought disaster designations.
Fact #2 - U.S. Drought Monitor is made with more than precipitation data.
When you think about drought, you probably think about water, or the lack of it. Precipitation plays a major role in the creation of the Drought Monitor, but the map’s author considers numerous indicators, including drought impacts and local insight from over 450 expert observers around the country. Authors use several dozen indicators to assess drought, including precipitation, streamflow, reservoir levels, temperature and evaporative demand, soil moisture and vegetation health. Because the drought monitor depicts both short and long‐term drought conditions, the authors must look at data for multiple timeframes. The final map produced each week represents a summary of the story being told by all the pieces of data. To help tell that story, authors don’t just look at data. They converse over the course of the map-making week with experts across the country and draw information about drought impacts from media reports and private citizens.
Fact #3 - A real person, using real data, updates the map.
Each week’s map author, not a computer, processes and analyzes data to update the drought monitor. The map authors are trained meteorologists from the National Drought Mitigation Center at the University of Nebraska-Lincoln (the academic partner and website host of the Drought Monitor), the National Oceanic and Atmospheric Administration, the National Aeronautics and Space Administration, and USDA. The author’s job is to do what a computer can’t – use their expertise to reconcile the sometimes-conflicting stories told by each stream of data into a single assessment.
Fact #4 - The Drought Monitor provides a current snapshot, not a forecast.
The Drought Monitor is a “snapshot” of conditions observed during the most recent week and builds off the previous week’s map. The map is released on Thursdays and depicts conditions based on data for the week that ended the preceding Tuesday. Rain that falls on the Wednesday just before the USDM’s release won’t be reflected until the next map is published. This provides a consistent, week‐to‐week product and gives the author a window to assess the data and come up with a final map.
Fact #5 – Your input can be part of the drought-monitoring process.
State observers in the drought monitoring network relay on-the-ground information from numerous sources to the US Drought monitor author each week. That can include information that you contribute.
The Drought Monitor serves as a trigger for multiple forms of federal disaster relief for agricultural producers, and sometimes producers contact the author to suggest that drought conditions in their area are worse than what the latest drought monitor shows. When the author gets a call like that, it prompts them to look closely at all available data for that area, to see whether measurements of precipitation, temperature, soil moisture and other indicators corroborate producer-submitted reports. This is the process that authors follow whether they receive one report or one hundred reports, although reports from more points may help state officials and others know where to look for impacts.
There are multiple ways to contribute your observations:
There are multiple ways to contribute your observations:
- Email – Emails sent to droughtmonitor@unl.edu direct to the USDM authors.
- Submit CMOR reports – Use the Condition Monitoring Observer Report (CMOR) system to provide information and photos about how drought is affecting your area. Your report will appear immediately on an interactive map and will help Drought Monitor authors and others interpret weather data.
- Become a CoCoRaHS observer – Submit drought reports along with daily precipitation observations to the Community Collaborative Rain, Hail & Snow Network.
For more information, read our Ask the Expert blog with a NDMC climatologist or visit farmers.gov/protection-recovery.
Ciji Taylor is a USDA public affairs specialist
 Loans and Grants
 Disaster Planning and Assistance
 Conservation
 Ag Business
 Farm Life