

In this Ask the Expert, climatologist Brian Fuchs, National Drought Mitigation Center at the University of Nebraska-Lincoln, discusses the U.S. Drought Monitor, the USDA programs triggered by the Monitor data and how the data can be used to inform decision-making by America‘s agricultural producers.

What is the U.S. Drought Monitor (USDM)?
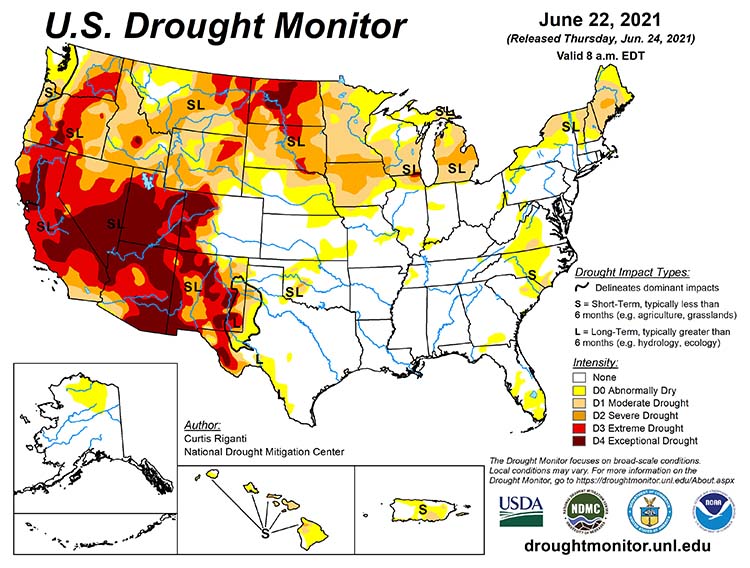
The U.S. Drought Monitor (USDM) is an online, weekly map showing the location, extent, and severity of drought across the United States. It categorizes the entire country as being in one of six levels of drought. The first two, None and Abnormally Dry (D0), are not considered to be drought. The next four describe increasing levels of drought: Moderate (D1), Severe (D2), Extreme (D3) and Exceptional (D4). The map is released on Thursdays and depicts conditions for the week that ended the preceding Tuesday.
Why is the USDM important to agricultural producers?
The USDM provides producers with the latest information about drought conditions where they live, enabling producers to best respond and react to a drought as it develops or lingers. In some cases, the USDM may help a producer make specific decisions about their operation, such as reducing the stocking rate because forage is not growing. For others, it may provide a convenient big-picture snapshot of broader environmental conditions.
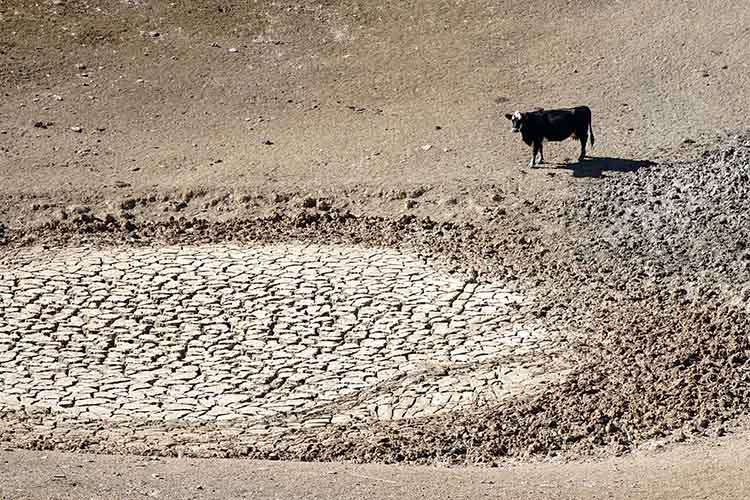
Drought not only affects how farmers, ranchers, and forest managers run their day-to-day operations, it also impacts our municipal water supply and water supply in general, the quality of our fish and wildlife habitats, and influences a variety of industries and livelihoods like landscaping, energy production, river navigation, and more.
USDA uses the USDM to determine a producer’s eligibility for certain drought assistance programs, like the Livestock Forage Disaster Program (LFP) and Emergency Haying or Grazing on CRP acres. Additionally, the Farm Service Agency uses the Drought Monitor to trigger and “fast track” Secretarial Disaster Designations which then provides producers impacted by drought access to emergency loans that can assist with credit needs.
How do you determine drought location and severity?
The USDM incorporates varying data – rain, snow, temperature, streamflow, reservoir levels, soil moisture, and more – as well as first-hand information submitted from on-the-ground sources such as photos, descriptions, and experiences. But sometimes the data tell different stories, especially over different lengths of time. For example, a rainy week may erase drought in people’s minds, but may not make up for long-term deficits and may not soak hard, dry soil.
The levels of drought are connected to the frequency of occurrence across several different drought indicators. A Moderate drought is one that happens, statistically, up to 20% of the time, and an Exceptional drought, up to 2% of the time, or once every 50 years. In reality, Exceptional droughts may happen in back-to-back years, or may not happen at all in 100 years.
Who creates the drought map?
The science that goes into detecting drought is climatology, which involves comparing data over time to understand what is normal for a particular place. The map authors are trained climatologists or meteorologists from the National Drought Mitigation Center at the University of Nebraska-Lincoln (the academic partner and website host of the USDM), the National Oceanic and Atmospheric Administration, and the U.S. Department of Agriculture.
What makes the USDM unique is that it is not a strictly numeric product. The mapmakers rely on their judgment and a nationwide network of 450-plus experts to interpret conditions for each region. They synthesize their discussion and analysis into a single depiction of drought for the entire country.
How does the U.S. Drought Monitor provide information for producers?
Earlier this month, the USDM added a feature where users can view drought data or maps for 323 tribal areas. While this information is not new, we now provide deeper insight into drought conditions and compute statistics for these areas, allowing users to shine a spotlight on how drought affects tribal communities.
The project to enhance tribal area data on the U.S. Drought Monitor site is the latest effort to make the USDM more accessible to historically underserved populations. A Spanish-language version of the USDM was previously created to provide weekly drought information for Spanish-speaking populations in the U.S.
How can people contribute to the USDM?
There are multiple ways to contribute your observations to the USDM process:
- Talk to your state climatologist - Find the current list at the American Association of State Climatologists website.
- Email - Emails sent to droughtmonitor@unl.edu inform the USDM authors.
- Become a CoCoRaHS observer - Submit drought reports along with daily precipitation observations to the Community Collaborative Rain, Hail & Snow Network.
- Submit Condition Monitoring Observer Reports (CMOR) - go.unl.edu/CMOR.
- Use the drought.gov contact form - Contact us online.
Additional Resources
For more information about the USDM, visit the USDM website and explore the USDM Tutorial.
On farmers.gov, the Disaster Assistance Discovery Tool, Disaster-at-a-Glance fact sheet, and Farm Loan Discovery Tool can help you determine which program or loan options may be right for you. For assistance with a crop insurance claim, contact your crop insurance agent. For FSA and NRCS programs, contact your local USDA Service Center.
Ciji Taylor is a public affairs specialist with USDA
 Loans and Grants
 Disaster Planning and Assistance
 Conservation
 Ag Business
 Farm Life